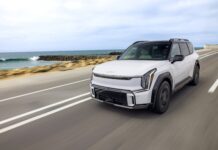
TORRANCE, Calif., June 3, 2019 /PRNewswire-HISPANIC PR WIRE/ —
|
American Honda |
Honda |
Acura |
||||||
|
Total |
Cars |
Trucks |
Total |
Cars |
Trucks |
Total |
Cars |
Trucks |
|
145,532 |
67,876 |
77,656 |
131,985 |
64,169 |
67,816 |
13,547 |
3,707 |
9,840 |
|
-4.9% |
-7.4% |
-2.7% |
-5.9% |
-7.3% |
-4.5% |
+5.7% |
-7.7% |
+11.8% |

“We’re seeing growth opportunities in cars and light trucks for both Honda and Acura brands as the market continues to level off,” said Henio Arcangeli, Jr. senior vice president of Automobile Sales at American Honda Motor Co. “Acura SUVs are leading the charge in luxury with RDX and MDX as consistent top sellers, while the Honda brand is extending its industry leadership in passenger car sales and building toward a full decade of SUV sales growth.”
|
Honda |
BRAND REPORT |
||
|
Sales Highlights |
Model Notes |
||
|
Honda’s faith in cars continues to pay dividends, with Civic pulling down a nearly 30% share of the compact segment—helping the brand increase its lead in retail passenger car sales. On the truck side, Passport gained new sales momentum with its best month since launch of the new generation last year.
|
Honda is growing its lead as the #1 retail passenger car brand in America, gaining the most share of any mainstream brand. |
||
|
CR-V is extending its lead as the retail #1 SUV/CUV in America and continues to fend off new competition, beating the new RAV4 in a Car and Driver comparison test. |
|||
|
Acura |
BRAND REPORT |
||
|
Sales Highlights |
Model Notes |
||
|
May brought strong sales results for Acura, with another record month for RDX, an 8% increase for MDX, and a 21% gain for ILX, Acura’s gateway model.
|
Acura is showing strength this year with 7% retail growth, while major competitors are stuck in neutral or showing losses in retail sales. |
||
|
The all-new RDX is completing its first year on the market with all-time record sales and now stands as the retail #1 model in luxury’s largest segment and #3 model in all of luxury. |
|||
|
American Honda Vehicle Sales for May 2019 |
||||||||||||||||||||
|
Month-to-Date |
Year-to-Date |
|||||||||||||||||||
|
May 2019 |
May 2018 |
DSR** % |
MoM % |
May 2019 |
May 2018 |
DSR** % |
YoY % |
|||||||||||||
|
American Honda Total |
145,532 |
153,069 |
-4.9% |
-4.9% |
641,094 |
641,261 |
0.0% |
0.0% |
||||||||||||
|
Total Car Sales |
67,876 |
73,261 |
-7.4% |
-7.4% |
294,411 |
303,065 |
-2.9% |
-2.9% |
||||||||||||
|
Total Truck Sales |
77,656 |
79,808 |
-2.7% |
-2.7% |
346,683 |
338,196 |
2.5% |
2.5% |
||||||||||||
|
Honda |
Total Car Sales |
64,169 |
69,244 |
-7.3% |
-7.3% |
276,652 |
282,981 |
-2.2% |
-2.2% |
|||||||||||
|
Honda |
Total Truck Sales |
67,816 |
71,006 |
-4.5% |
-4.5% |
302,823 |
300,159 |
0.9% |
0.9% |
|||||||||||
|
Acura |
Total Car Sales |
3,707 |
4,017 |
-7.7% |
-7.7% |
17,759 |
20,084 |
-11.6% |
-11.6% |
|||||||||||
|
Acura |
Total Truck Sales |
9,840 |
8,802 |
11.8% |
11.8% |
43,860 |
38,037 |
15.3% |
15.3% |
|||||||||||
|
* Total Domestic Car Sales |
57,222 |
60,463 |
-5.4% |
-5.4% |
240,293 |
259,743 |
-7.5% |
-7.5% |
||||||||||||
|
Honda Division |
53,606 |
56,609 |
-5.3% |
-5.3% |
223,157 |
240,456 |
-7.2% |
-7.2% |
||||||||||||
|
Acura Division |
3,616 |
3,854 |
-6.2% |
-6.2% |
17,136 |
19,287 |
-11.2% |
-11.2% |
||||||||||||
|
* Total Domestic Truck Sales |
75,792 |
79,808 |
-5.0% |
-5.0% |
332,888 |
338,196 |
-1.6% |
-1.6% |
||||||||||||
|
Honda Division |
65,952 |
71,006 |
-7.1% |
-7.1% |
289,028 |
300,159 |
-3.7% |
-3.7% |
||||||||||||
|
Acura Division |
9,840 |
8,802 |
11.8% |
11.8% |
43,860 |
38,037 |
15.3% |
15.3% |
||||||||||||
|
Total Import Car Sales |
10,654 |
12,798 |
-16.8% |
-16.8% |
54,118 |
43,322 |
24.9% |
24.9% |
||||||||||||
|
Honda Division |
10,563 |
12,635 |
-16.4% |
-16.4% |
53,495 |
42,525 |
25.8% |
25.8% |
||||||||||||
|
Acura Division |
91 |
163 |
-44.2% |
-44.2% |
623 |
797 |
-21.8% |
-21.8% |
||||||||||||
|
Total Import Truck Sales |
1,864 |
0 |
0.0% |
0.0% |
13,795 |
0 |
0.0% |
0.0% |
||||||||||||
|
Honda Division |
1,864 |
0 |
0.0% |
0.0% |
13,795 |
0 |
0.0% |
0.0% |
||||||||||||
|
Acura Division |
0 |
0 |
0.0% |
0.0% |
0 |
0 |
0.0% |
0.0% |
||||||||||||
|
MODEL BREAKOUT BY DIVISION |
||||||||||||||||||||
|
Honda Division Total |
131,985 |
140,250 |
-5.9% |
-5.9% |
579,475 |
583,140 |
-0.6% |
-0.6% |
||||||||||||
|
ACCORD |
23,892 |
28,212 |
-15.3% |
-15.3% |
107,542 |
111,564 |
-3.6% |
-3.6% |
||||||||||||
|
CIVIC |
32,800 |
34,349 |
-4.5% |
-4.5% |
139,421 |
144,897 |
-3.8% |
-3.8% |
||||||||||||
|
CLARITY |
906 |
1,706 |
-46.9% |
-46.9% |
5,953 |
6,235 |
-4.5% |
-4.5% |
||||||||||||
|
CR-Z |
0 |
1 |
-100.0% |
-100.0% |
2 |
31 |
-93.5% |
-93.5% |
||||||||||||
|
FIT |
3,918 |
4,976 |
-21.3% |
-21.3% |
13,553 |
20,254 |
-33.1% |
-33.1% |
||||||||||||
|
INSIGHT |
2,653 |
0 |
0.0% |
0.0% |
10,181 |
0 |
0.0% |
0.0% |
||||||||||||
|
CR-V |
30,893 |
35,905 |
-14.0% |
-14.0% |
146,517 |
146,274 |
0.2% |
0.2% |
||||||||||||
|
HR-V |
8,565 |
8,773 |
-2.4% |
-2.4% |
37,486 |
36,898 |
1.6% |
1.6% |
||||||||||||
|
ODYSSEY |
9,519 |
9,861 |
-3.5% |
-3.5% |
38,298 |
41,332 |
-7.3% |
-7.3% |
||||||||||||
|
PASSPORT |
3,434 |
0 |
0.0% |
0.0% |
11,155 |
0 |
0.0% |
0.0% |
||||||||||||
|
PILOT |
12,517 |
13,573 |
-7.8% |
-7.8% |
56,873 |
63,297 |
-10.1% |
-10.1% |
||||||||||||
|
RIDGELINE |
2,888 |
2,894 |
-0.2% |
-0.2% |
12,494 |
12,358 |
1.1% |
1.1% |
||||||||||||
|
Acura Division Total |
13,547 |
12,819 |
5.7% |
5.7% |
61,619 |
58,121 |
6.0% |
6.0% |
||||||||||||
|
ILX |
1,351 |
1,116 |
21.1% |
21.1% |
5,644 |
4,600 |
22.7% |
22.7% |
||||||||||||
|
NSX |
30 |
15 |
100.0% |
100.0% |
132 |
87 |
51.7% |
51.7% |
||||||||||||
|
RLX / RL |
91 |
163 |
-44.2% |
-44.2% |
623 |
797 |
-21.8% |
-21.8% |
||||||||||||
|
TLX |
2,235 |
2,723 |
-17.9% |
-17.9% |
11,360 |
14,600 |
-22.2% |
-22.2% |
||||||||||||
|
MDX |
4,425 |
4,098 |
8.0% |
8.0% |
18,547 |
18,007 |
3.0% |
3.0% |
||||||||||||
|
RDX |
5,415 |
4,704 |
15.1% |
15.1% |
25,313 |
20,030 |
26.4% |
26.4% |
||||||||||||
|
Selling Days |
26 |
26 |
127 |
127 |
||||||||||||||||
|
**** Electrified Vehicles |
6,262 |
4,629 |
35.3% |
35.3% |
26,637 |
11,658 |
128.5% |
128.5% |
||||||||||||
|
* Honda and Acura vehicles are made of domestic & global sourced parts |
||||||||||||||||||||
|
** Daily Selling Rate |
||||||||||||||||||||
|
**** Electrified Vehicles equal: Total sales of Hybrid (FHEV & PHEV), EVs (BEV) and Fuel Cell Vehicles (FCV) from the Honda and Acura brands. |
||||||||||||||||||||

Photo – https://mma.prnewswire.com/media/896472/2020_Acura_RDX.jpg
PDF – https://mma.prnewswire.com/media/896473/Honda_May_2019_Sales.pdf
Logo – https://mma.prnewswire.com/media/477245/HONDALOGO_Logo.jpg
SOURCE American Honda Motor Co., Inc.


