



QVC and HSN’s The Big Find Goes Virtual for 2020

WEST CHESTER, Pennsylvania, July 8, 2020 /PRNewswire-HISPANIC PR WIRE/ — QVC US and HSN, the world leaders in building brands through multiplatform storytelling, today announce the return of The Big Find®, an international search to discover entrepreneurs with the next big brand or unique product for a once-in-a-lifetime opportunity to share their stories with an audience of millions.

The Big Find pitch panel experience has been reimagined as an entirely virtual event to allow for safe and convenient engagement between vendors and QVC and HSN judges. The first step in the process of discovery is for entrepreneurs and inventors to complete an application that includes a video submission on their product or product lines from July 8 through August 19.
Selected candidates will then be invited to pitch their products virtually in September via videoconference to a panel of QVC and HSN judges, including merchandising executives, program hosts, and brand founders from established QVC and HSN brands. The panel of QVC and HSN judges will interview candidates to learn more about their brand story, background on the product or invention and what makes the product interesting or relevant. If an entrepreneur or vendor is identified as a ‘Big Ticket’ recipient, she or he will be invited to continue the product discovery process with QVC or HSN which includes meetings with merchandising teams and a robust quality assurance process before the brand is chosen to launch on-air and on-line across all platforms.
This year’s search has been expanded to include nine categories. Last year, entrepreneurs representing apparel, jewelry, accessories, footwear and beauty applied for The Big Find. In 2020, QVC and HSN are adding home décor, home innovation, electronics and culinary including food to the eligible category list. Expansion into the four new categories is due, in part, to extraordinary growth in these categories. Shoppers’ buying habits shifted during the last several months of restricted activities and products in the category of ‘home essentials’ including home office, food & storage, tech resources and beautification of home have become shoppers’ primary interest.
Through The Big Find and similar initiatives, QVC and HSN have built a track record of launching and fostering the growth of up-and-coming brands and small businesses by harnessing the power of storytelling and discovery-driven shopping experiences. Over the years, the two retailers have helped multiple entrepreneurial brands become national and international success stories, including IT Cosmetics, TATCHA, SPANX®, Junior’s Cheesecake, Korres, and others.
“Our business has always been rooted in discovering and nurturing authentic, emerging brands, and our customers have really enjoyed getting to know the many inspiring entrepreneurs and products we discovered through last year’s Big Find,” said Mary Campbell, Chief Merchandising Officer, Qurate Retail Group, and Chief Commerce Officer, QVC US. “We’re excited about building on that success with this year’s search. By adding new categories, we look forward to creating even more opportunities for entrepreneurs with unique products and compelling stories to work with us in curating differentiated product experiences for our customers.”
Last year’s inaugural Big Find nationwide search brought in more than 650 entries from 43 US states, the District of Columbia, and 12 countries including Australia, Canada, Germany, India, South Africa, Switzerland and United Kingdom, among others. More than 65 rising brands in beauty and fashion were selected to introduce their products across QVC and HSN platforms throughout 2020, including Act & Acre, Alkaglam, Mented Cosmetics, Follain, Have Some Fun Today, Valencia Key and many more. This year, QVC and HSN expect to exceed the number of brands identified through The Big Find 2020.
“Participating in The Big Find and becoming a part of the QVC and HSN vendor community has been an incredible journey,” said KJ Miller, Co-Founder, Mented Cosmetics. “The platforms have allowed us to share our story with a new set of customers and bring our brand to life in a way we would not be able to achieve through traditional retail channels. The teams at QVC and HSN have guided our way throughout this entire experience, providing us with invaluable feedback and support. We have already seen strong growth to our business, and we are looking forward to continued success together.”
QVC and HSN have further deepened their support of small businesses this year through Qurate Retail’s Small Business Spotlight initiative, in collaboration with the NRF Foundation. Through this initiative, QVC and HSN have provided a visibility platform and a mentorship program to approximately 20 small businesses across the country. In addition, the companies are launching a new phase of the Small Business Spotlight to highlight Black-owned small businesses across their on-air and digital platforms as well as Black-owned brands that are current QVC and HSN vendors.
To learn more about The Big Find, search “The Big Find” on QVC.com and HSN.com.
About QVC® and HSN®
QVC delivers the joy of discovery through the power of relationships. Every day, QVC engages millions of shoppers in a journey of discovery through an ever-changing collection of familiar brands and fresh new products, from home and fashion to beauty, electronics, and jewelry. Along the way, QVC connects shoppers to interesting personalities, engaging stories, and award-winning customer service. Based in West Chester, PA and founded in 1986, QVC has retail operations in the U.S., the U.K., Germany, Japan, Italy, and through a joint venture in China. Worldwide, QVC engages shoppers on 13 broadcast networks reaching approximately 380 million homes and on multiple websites, mobile apps, and social pages. To learn more, visit corporate.qvc.com, follow @QVC on Facebook, Instagram, or Twitter, or follow QVC on Pinterest, YouTube, or LinkedIn.
HSN delivers the thrill of discovery through inspiring her passions. HSN is a leading interactive and lifestyle retailer, offering a curated assortment of exclusive products and top brand names to its customers. HSN incorporates entertainment, personalities, and industry experts to provide an entirely unique shopping experience. At HSN, customers find exceptional selections in health and beauty, jewelry, home/lifestyle, fashion/accessories, and electronics. HSN engages customers on two broadcast networks reaching approximately 92 million homes, and on a website, mobile apps, and social pages. HSN was founded over 40 years ago as the first shopping network and is based in St. Petersburg, Fla. To learn more, visit corporate.hsn.com, follow @HSN on Facebook, Instagram, or Twitter, or follow HSN on Pinterest, YouTube, or LinkedIn.
Qurate Retail, Inc. (NASDAQ: QRTEA, QRTEB) includes QVC®, HSN, Zulily® and the Cornerstone brands (collectively, “Qurate Retail GroupSM“), as well as other minority interests and green energy investments. Qurate Retail Group believes in a Third Way to Shop® – beyond transactional ecommerce or traditional brick-and-mortar stores. In addition to being #1 in video commerce, Qurate Retail Group is among the top 10 ecommerce retailers in North America (according to Digital Commerce 360) and is a leader in mobile commerce and social commerce. For more information, visit www.qurateretailgroup.com, follow @QurateRetailGrp on Facebook, Instagram or Twitter, or follow Qurate Retail Group on YouTube or LinkedIn.

Logo – https://mma.prnewswire.com/media/1092805/QVC_Logo.jpg
Logo – https://mma.prnewswire.com/media/1092804/HSN_Logo.jpg
SOURCE QVC and HSN
The National Hispanic Corporate Council Confirms Eduardo Arabu as Executive Director
WASHINGTON, July 8, 2020 /PRNewswire-HISPANIC PR WIRE/ — The Board of Directors of the National Hispanic Corporate Council (NHCC), the premiere resource for corporate America on maximizing the Hispanic market opportunity, announced Eduardo Arabu as its Executive Director effective July 1. Arabu has served as the Interim Executive Director since last fall. As the Executive Director, Eduardo will continue to set the overall enterprise vision and strategic direction for the organization and its Fortune 1,000 member corporations.
“The NHCC Board is incredibly thankful to Eduardo for all he has done for NHCC along with his dedication and passion in helping our corporate members leverage the U.S. Hispanic market,” said Brian Hall, NHCC Board Chair and Manager, Supplier Diversity & Brand Advocacy at Shell. “During his 6 years with NHCC, Eduardo brought vision, structure, and stability to our organization.
“I am honored to lead NHCC and to play a part in the organization’s development and resource delivery to our Fortune 1000 member companies,” said Arabu. “NHCC of today is member focused, innovative, and committed to delivering cultural competency and resources for companies to solve challenges and problems. I look forward to continuing to work with our extraordinary leadership group to deliver on NHCC’s strategic priorities and help corporation better compete in the U.S. Hispanic market,” said Arabu.
Arabu served as NHCC’s Interim Executive Director since September 1, 2019. He joined NHCC in 2014 as Manager of Administration & Special Events where he was responsible for the management and coordination of all NHCC’s events. He was promoted in 2016 to the role of Associate Director. Throughout his time with NHCC, Arabu has demonstrated to be an effective leader, he has excelled on all his roles, built key relationships for the organization, and effectively served NHCC corporate members.
Arabu has experience with corporations, not-for-profit organizations, educational institutions, sport entities, and governmental agencies. Most recent, Arabu worked for the United States Chamber of Commerce, the Chicago Cubs baseball organization, the Office of U.S. Representative, the Office of Illinois State Senator, and several corporations.
Arabu obtained a Bachelor of Science degree in business from Northeastern Illinois University. He went on to complete a political management fellowship at George Washington University. Arabu received a Master of Science degree in public policy and management from the Heinz College at Carnegie Mellon University.
About NHCC: Founded in 1985, NHCC is a collaborative community for Fortune 1000 members that provides access to Hispanic talent and consumer resources to optimize corporate performance.
NHCC’s Center of Expertise provides a five-pillar approach through executive leadership, talent/human resources, marketing, supplier diversity, and community relations within Hispanic and D&I space. An affiliation with NHCC provides a collaborative community that shares resources, knowledge, best practices, and innovative solutions to grow Hispanic talent, customers, suppliers, and community relations.
MEDIA CONTACT: Eduardo Arabu | (202) 772-1100 | [email protected] | www.nhcchq.org
Logo – https://mma.prnewswire.com/media/10591/national_hispanic_corporate_council_nhcc_logo1444.jpg
SOURCE National Hispanic Corporate Council
Avon Announces Over $16 Million in Product Donations

NEW YORK, July 8, 2020 /PRNewswire-HISPANIC PR WIRE/ — Avon has donated over $16 million worth of products to numerous charitable organizations as part of its continuing commitment to giving back and making a positive impact on the world. Donations include AMAR in Puerto Rico and Avon’s longtime partner, Feed the Children. Both organizations are crucial right now in providing supplies for those in need during the pandemic. Donations were also made to the Marine Toys for Tots program.

Avon Puerto Rico has donated $1.3 million in product donations to AMAR, Alianza de Médicos Al Rescate (Alliance of Physicians to the Rescue). AMAR is dedicated to taking medicines and essential items to communities in need. For more than 25 years, they have provided free voluntary health services to the most vulnerable communities. Avon’s donations to AMAR last month include clothing, personal care products, cosmetics, home products and more.
Feed the Children works closely with community partners like schools, civic organizations and food banks to serve the most vulnerable populations and others who may be experiencing difficulty due to a job loss in this uncertain environment. This past month, Avon donated over $13 million worth of products to Feed the Children to support these families in need. Over the last sixteen years, Avon has donated over 15,000,000 pounds of personal care and beauty products, clothing, shoes and home essentials to Feed the Children bringing relief to millions of families.
The Marine Toys for Tots has received a $2.4 million toy donation from Avon to support their mission to collect and distribute new toys for less fortunate children during the holidays. Over 60,000 toys were sent from Avon to Toys for Tots for the upcoming holiday season. Avon is proud to be a 5-Star National Corporate Sponsor for 2020.
ABOUT NEW AVON COMPANY
New Avon (“New Avon Company”) is the leading social selling beauty company in North America, with independent sales Representatives throughout the United States and Puerto Rico. Avon’s portfolio includes award-winning skincare, color cosmetics, fragrance, personal care, and health and wellness products featuring brands such as ANEW, Skin So Soft, belif, CHI, and The Face Shop, as well as home essentials, fashion and accessories. Avon has a 134-year history of empowering women through economic opportunity, and supporting the causes that matter most to women. Avon philanthropy has contributed over $1 billion globally toward eradicating breast cancer and domestic violence. Learn more about New Avon and its products at www.avon.com.
For more information, please contact Susan Small [email protected], 212-282-6066
Logo – https://mma.prnewswire.com/media/1092042/AVON_Logo.jpg
SOURCE New Avon Company
Miller Lite and the Hispanic Association of Colleges and Universities (HACU) Offer $180,000 in College Scholarships
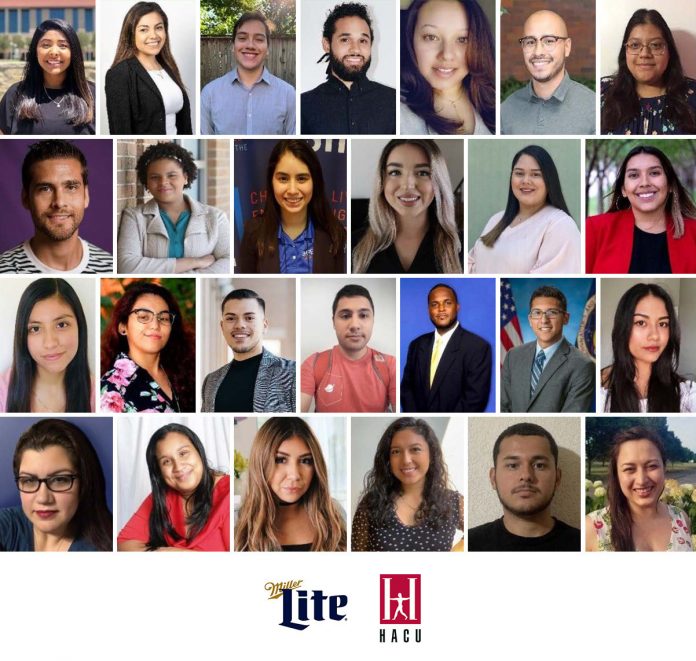
CHICAGO, July 8, 2020 /PRNewswire-HISPANIC PR WIRE/ — Miller Lite and the Hispanic Association of Colleges and Universities are supporting the next generation of Hispanic leaders by awarding $180,000 in college scholarships and leadership development. In addition to the scholarships, the 40 recipients will get a spot at HACU’s ¡Adelante! Leadership Institute where they will learn how to use their unique voices to become great leaders. Applications must be submitted online through hacu.net/hacu/Scholarships.asp before July 31.
Forty scholarships between $2,500 and $5,000 will be awarded to eligible college students in California, Colorado, Florida, Illinois, New York, Texas, Wisconsin and Puerto Rico. Eight scholarships of $5,000 will be awarded in Houston and 12 of $2,500 to other cities in Texas. Scholarships are open to college students who are over 21 years of age, attend a HACU-member institution in a participating market, and are U.S. citizens, permanent residents or DACA recipients.
“As a brand that believes in the power of being your authentic self, we recognize the importance of supporting future leaders with diverse perspectives and backgrounds,” said Allison Wallin, Miller Lite Marketing Manager at Molson Coors. “This is why every year Miller Lite works with HACU to provide college scholarships and professional development opportunities to the Hispanic community.”
According to the U.S. Department of Education, only 54 percent of Hispanic students finish a bachelor’s degree within six years. Financial constraints continue to be one of the primary factors for college students that don’t graduate, which is why in the last two decades Molson Coors has donated nearly one million dollars to HACU to help Champion Hispanic Success in Higher Education.
“We are thrilled to continue our longstanding partnership with Miller Lite,” said HACU President and CEO Antonio R. Flores. “Together we have awarded nearly $650,000 in scholarships and we hope to provide Hispanic students with more opportunities for years to come.”
Visit hacu.net for more information on the scholarships and full eligibility criteria. Follow HACU at Facebook.com/HACUnews, or @HACUnews on Twitter and Instagram.
For more information on Miller Lite, visit MillerLite.com, Facebook.com/MillerLite, and follow @MillerLite on Twitter and Instagram.
About Molson Coors Beverage Company
For over two centuries Molson Coors has been brewing beverages that unite people for all of life’s moments. From Coors Light, Miller Lite, Molson Canadian, Carling, and Staropramen to Coors Banquet, Blue Moon Belgian White, Saint Archer Gold, Leinenkugel’s Summer Shandy, Creemore Springs and more, Molson Coors produces some of the most beloved and iconic beer brands ever made. While the company’s history is rooted in beer, Molson Coors offers a modern portfolio that expands beyond the beer aisle with sparkling cocktails, hard coffee, canned wine, kombucha, cider and more.
Molson Coors Beverage Company is a publicly traded company that operates through Molson Coors North America and Molson Coors Europe, and is traded on the New York and Toronto Stock Exchanges. The company’s commitment to raising industry standards and leaving a positive imprint on our employees, consumers, communities and the environment is reflected in Our Beer Print and our 2025 sustainability targets. To learn more about Molson Coors Beverage Company, visit www.molsoncoors.com.
About HACU
HACU, founded in 1986, represents more than 500 colleges and universities in the United States, Puerto Rico, Latin America, Spain and school districts throughout the U.S. HACU is the only national association representing existing and emerging Hispanic-Serving Institutions (HSIs). The mission of HACU is to Champion Hispanic Success in Higher Education. The Association’s headquarters are located in San Antonio, Texas, with regional offices in Washington D.C., and Sacramento, California. Information is available at www.hacu.net.
Photo – https://mma.prnewswire.com/media/1201687/HACU_and_Miller_Lite_2019.jpg
Logo – https://mma.prnewswire.com/media/412972/Miller_Lite_Logo.jpg
SOURCE Miller Lite
QVC and HSN’s The Big Find Goes Virtual for 2020

WEST CHESTER, Pennsylvania, July 8, 2020 /PRNewswire-HISPANIC PR WIRE/ — QVC US and HSN, the world leaders in building brands through multiplatform storytelling, today announce the return of The Big Find®, an international search to discover entrepreneurs with the next big brand or unique product for a once-in-a-lifetime opportunity to share their stories with an audience of millions.
The Big Find pitch panel experience has been reimagined as an entirely virtual event to allow for safe and convenient engagement between vendors and QVC and HSN judges. The first step in the process of discovery is for entrepreneurs and inventors to complete an application that includes a video submission on their product or product lines from July 8 through August 19.
Selected candidates will then be invited to pitch their products virtually in September via videoconference to a panel of QVC and HSN judges, including merchandising executives, program hosts, and brand founders from established QVC and HSN brands. The panel of QVC and HSN judges will interview candidates to learn more about their brand story, background on the product or invention and what makes the product interesting or relevant. If an entrepreneur or vendor is identified as a ‘Big Ticket’ recipient, she or he will be invited to continue the product discovery process with QVC or HSN which includes meetings with merchandising teams and a robust quality assurance process before the brand is chosen to launch on-air and on-line across all platforms.
This year’s search has been expanded to include nine categories. Last year, entrepreneurs representing apparel, jewelry, accessories, footwear and beauty applied for The Big Find. In 2020, QVC and HSN are adding home décor, home innovation, electronics and culinary including food to the eligible category list. Expansion into the four new categories is due, in part, to extraordinary growth in these categories. Shoppers’ buying habits shifted during the last several months of restricted activities and products in the category of ‘home essentials’ including home office, food & storage, tech resources and beautification of home have become shoppers’ primary interest.
Through The Big Find and similar initiatives, QVC and HSN have built a track record of launching and fostering the growth of up-and-coming brands and small businesses by harnessing the power of storytelling and discovery-driven shopping experiences. Over the years, the two retailers have helped multiple entrepreneurial brands become national and international success stories, including IT Cosmetics, TATCHA, SPANX®, Junior’s Cheesecake, Korres, and others.
“Our business has always been rooted in discovering and nurturing authentic, emerging brands, and our customers have really enjoyed getting to know the many inspiring entrepreneurs and products we discovered through last year’s Big Find,” said Mary Campbell, Chief Merchandising Officer, Qurate Retail Group, and Chief Commerce Officer, QVC US. “We’re excited about building on that success with this year’s search. By adding new categories, we look forward to creating even more opportunities for entrepreneurs with unique products and compelling stories to work with us in curating differentiated product experiences for our customers.”
Last year’s inaugural Big Find nationwide search brought in more than 650 entries from 43 US states, the District of Columbia, and 12 countries including Australia, Canada, Germany, India, South Africa, Switzerland and United Kingdom, among others. More than 65 rising brands in beauty and fashion were selected to introduce their products across QVC and HSN platforms throughout 2020, including Act & Acre, Alkaglam, Mented Cosmetics, Follain, Have Some Fun Today, Valencia Key and many more. This year, QVC and HSN expect to exceed the number of brands identified through The Big Find 2020.
“Participating in The Big Find and becoming a part of the QVC and HSN vendor community has been an incredible journey,” said KJ Miller, Co-Founder, Mented Cosmetics. “The platforms have allowed us to share our story with a new set of customers and bring our brand to life in a way we would not be able to achieve through traditional retail channels. The teams at QVC and HSN have guided our way throughout this entire experience, providing us with invaluable feedback and support. We have already seen strong growth to our business, and we are looking forward to continued success together.”
QVC and HSN have further deepened their support of small businesses this year through Qurate Retail’s Small Business Spotlight initiative, in collaboration with the NRF Foundation. Through this initiative, QVC and HSN have provided a visibility platform and a mentorship program to approximately 20 small businesses across the country. In addition, the companies are launching a new phase of the Small Business Spotlight to highlight Black-owned small businesses across their on-air and digital platforms as well as Black-owned brands that are current QVC and HSN vendors.
To learn more about The Big Find, search “The Big Find” on QVC.com and HSN.com.
About QVC® and HSN®
QVC delivers the joy of discovery through the power of relationships. Every day, QVC engages millions of shoppers in a journey of discovery through an ever-changing collection of familiar brands and fresh new products, from home and fashion to beauty, electronics, and jewelry. Along the way, QVC connects shoppers to interesting personalities, engaging stories, and award-winning customer service. Based in West Chester, PA and founded in 1986, QVC has retail operations in the U.S., the U.K., Germany, Japan, Italy, and through a joint venture in China. Worldwide, QVC engages shoppers on 13 broadcast networks reaching approximately 380 million homes and on multiple websites, mobile apps, and social pages. To learn more, visit corporate.qvc.com, follow @QVC on Facebook, Instagram, or Twitter, or follow QVC on Pinterest, YouTube, or LinkedIn.
HSN delivers the thrill of discovery through inspiring her passions. HSN is a leading interactive and lifestyle retailer, offering a curated assortment of exclusive products and top brand names to its customers. HSN incorporates entertainment, personalities, and industry experts to provide an entirely unique shopping experience. At HSN, customers find exceptional selections in health and beauty, jewelry, home/lifestyle, fashion/accessories, and electronics. HSN engages customers on two broadcast networks reaching approximately 92 million homes, and on a website, mobile apps, and social pages. HSN was founded over 40 years ago as the first shopping network and is based in St. Petersburg, Fla. To learn more, visit corporate.hsn.com, follow @HSN on Facebook, Instagram, or Twitter, or follow HSN on Pinterest, YouTube, or LinkedIn.
Qurate Retail, Inc. (NASDAQ: QRTEA, QRTEB) includes QVC®, HSN, Zulily® and the Cornerstone brands (collectively, “Qurate Retail GroupSM“), as well as other minority interests and green energy investments. Qurate Retail Group believes in a Third Way to Shop® – beyond transactional ecommerce or traditional brick-and-mortar stores. In addition to being #1 in video commerce, Qurate Retail Group is among the top 10 ecommerce retailers in North America (according to Digital Commerce 360) and is a leader in mobile commerce and social commerce. For more information, visit www.qurateretailgroup.com, follow @QurateRetailGrp on Facebook, Instagram or Twitter, or follow Qurate Retail Group on YouTube or LinkedIn.

Logo – https://mma.prnewswire.com/media/1092805/QVC_Logo.jpg
Logo – https://mma.prnewswire.com/media/1092804/HSN_Logo.jpg
SOURCE QVC and HSN
QVC and HSN’s The Big Find Goes Virtual for 2020

WEST CHESTER, Pennsylvania, July 8, 2020 /PRNewswire-HISPANIC PR WIRE/ — QVC US and HSN, the world leaders in building brands through multiplatform storytelling, today announce the return of The Big Find®, an international search to discover entrepreneurs with the next big brand or unique product for a once-in-a-lifetime opportunity to share their stories with an audience of millions.
The Big Find pitch panel experience has been reimagined as an entirely virtual event to allow for safe and convenient engagement between vendors and QVC and HSN judges. The first step in the process of discovery is for entrepreneurs and inventors to complete an application that includes a video submission on their product or product lines from July 8 through August 19.
Selected candidates will then be invited to pitch their products virtually in September via videoconference to a panel of QVC and HSN judges, including merchandising executives, program hosts, and brand founders from established QVC and HSN brands. The panel of QVC and HSN judges will interview candidates to learn more about their brand story, background on the product or invention and what makes the product interesting or relevant. If an entrepreneur or vendor is identified as a ‘Big Ticket’ recipient, she or he will be invited to continue the product discovery process with QVC or HSN which includes meetings with merchandising teams and a robust quality assurance process before the brand is chosen to launch on-air and on-line across all platforms.
This year’s search has been expanded to include nine categories. Last year, entrepreneurs representing apparel, jewelry, accessories, footwear and beauty applied for The Big Find. In 2020, QVC and HSN are adding home décor, home innovation, electronics and culinary including food to the eligible category list. Expansion into the four new categories is due, in part, to extraordinary growth in these categories. Shoppers’ buying habits shifted during the last several months of restricted activities and products in the category of ‘home essentials’ including home office, food & storage, tech resources and beautification of home have become shoppers’ primary interest.
Through The Big Find and similar initiatives, QVC and HSN have built a track record of launching and fostering the growth of up-and-coming brands and small businesses by harnessing the power of storytelling and discovery-driven shopping experiences. Over the years, the two retailers have helped multiple entrepreneurial brands become national and international success stories, including IT Cosmetics, TATCHA, SPANX®, Junior’s Cheesecake, Korres, and others.
“Our business has always been rooted in discovering and nurturing authentic, emerging brands, and our customers have really enjoyed getting to know the many inspiring entrepreneurs and products we discovered through last year’s Big Find,” said Mary Campbell, Chief Merchandising Officer, Qurate Retail Group, and Chief Commerce Officer, QVC US. “We’re excited about building on that success with this year’s search. By adding new categories, we look forward to creating even more opportunities for entrepreneurs with unique products and compelling stories to work with us in curating differentiated product experiences for our customers.”
Last year’s inaugural Big Find nationwide search brought in more than 650 entries from 43 US states, the District of Columbia, and 12 countries including Australia, Canada, Germany, India, South Africa, Switzerland and United Kingdom, among others. More than 65 rising brands in beauty and fashion were selected to introduce their products across QVC and HSN platforms throughout 2020, including Act & Acre, Alkaglam, Mented Cosmetics, Follain, Have Some Fun Today, Valencia Key and many more. This year, QVC and HSN expect to exceed the number of brands identified through The Big Find 2020.
“Participating in The Big Find and becoming a part of the QVC and HSN vendor community has been an incredible journey,” said KJ Miller, Co-Founder, Mented Cosmetics. “The platforms have allowed us to share our story with a new set of customers and bring our brand to life in a way we would not be able to achieve through traditional retail channels. The teams at QVC and HSN have guided our way throughout this entire experience, providing us with invaluable feedback and support. We have already seen strong growth to our business, and we are looking forward to continued success together.”
QVC and HSN have further deepened their support of small businesses this year through Qurate Retail’s Small Business Spotlight initiative, in collaboration with the NRF Foundation. Through this initiative, QVC and HSN have provided a visibility platform and a mentorship program to approximately 20 small businesses across the country. In addition, the companies are launching a new phase of the Small Business Spotlight to highlight Black-owned small businesses across their on-air and digital platforms as well as Black-owned brands that are current QVC and HSN vendors.
To learn more about The Big Find, search “The Big Find” on QVC.com and HSN.com.
About QVC® and HSN®
QVC delivers the joy of discovery through the power of relationships. Every day, QVC engages millions of shoppers in a journey of discovery through an ever-changing collection of familiar brands and fresh new products, from home and fashion to beauty, electronics, and jewelry. Along the way, QVC connects shoppers to interesting personalities, engaging stories, and award-winning customer service. Based in West Chester, PA and founded in 1986, QVC has retail operations in the U.S., the U.K., Germany, Japan, Italy, and through a joint venture in China. Worldwide, QVC engages shoppers on 13 broadcast networks reaching approximately 380 million homes and on multiple websites, mobile apps, and social pages. To learn more, visit corporate.qvc.com, follow @QVC on Facebook, Instagram, or Twitter, or follow QVC on Pinterest, YouTube, or LinkedIn.
HSN delivers the thrill of discovery through inspiring her passions. HSN is a leading interactive and lifestyle retailer, offering a curated assortment of exclusive products and top brand names to its customers. HSN incorporates entertainment, personalities, and industry experts to provide an entirely unique shopping experience. At HSN, customers find exceptional selections in health and beauty, jewelry, home/lifestyle, fashion/accessories, and electronics. HSN engages customers on two broadcast networks reaching approximately 92 million homes, and on a website, mobile apps, and social pages. HSN was founded over 40 years ago as the first shopping network and is based in St. Petersburg, Fla. To learn more, visit corporate.hsn.com, follow @HSN on Facebook, Instagram, or Twitter, or follow HSN on Pinterest, YouTube, or LinkedIn.
Qurate Retail, Inc. (NASDAQ: QRTEA, QRTEB) includes QVC®, HSN, Zulily® and the Cornerstone brands (collectively, “Qurate Retail GroupSM“), as well as other minority interests and green energy investments. Qurate Retail Group believes in a Third Way to Shop® – beyond transactional ecommerce or traditional brick-and-mortar stores. In addition to being #1 in video commerce, Qurate Retail Group is among the top 10 ecommerce retailers in North America (according to Digital Commerce 360) and is a leader in mobile commerce and social commerce. For more information, visit www.qurateretailgroup.com, follow @QurateRetailGrp on Facebook, Instagram or Twitter, or follow Qurate Retail Group on YouTube or LinkedIn.
Logo – https://mma.prnewswire.com/media/1092805/QVC_Logo.jpg
Logo – https://mma.prnewswire.com/media/1092804/HSN_Logo.jpg
SOURCE QVC and HSN
QVC and HSN’s The Big Find Goes Virtual for 2020

WEST CHESTER, Pennsylvania, July 8, 2020 /PRNewswire-HISPANIC PR WIRE/ — QVC US and HSN, the world leaders in building brands through multiplatform storytelling, today announce the return of The Big Find®, an international search to discover entrepreneurs with the next big brand or unique product for a once-in-a-lifetime opportunity to share their stories with an audience of millions.
The Big Find pitch panel experience has been reimagined as an entirely virtual event to allow for safe and convenient engagement between vendors and QVC and HSN judges. The first step in the process of discovery is for entrepreneurs and inventors to complete an application that includes a video submission on their product or product lines from July 8 through August 19.
Selected candidates will then be invited to pitch their products virtually in September via videoconference to a panel of QVC and HSN judges, including merchandising executives, program hosts, and brand founders from established QVC and HSN brands. The panel of QVC and HSN judges will interview candidates to learn more about their brand story, background on the product or invention and what makes the product interesting or relevant. If an entrepreneur or vendor is identified as a ‘Big Ticket’ recipient, she or he will be invited to continue the product discovery process with QVC or HSN which includes meetings with merchandising teams and a robust quality assurance process before the brand is chosen to launch on-air and on-line across all platforms.
This year’s search has been expanded to include nine categories. Last year, entrepreneurs representing apparel, jewelry, accessories, footwear and beauty applied for The Big Find. In 2020, QVC and HSN are adding home décor, home innovation, electronics and culinary including food to the eligible category list. Expansion into the four new categories is due, in part, to extraordinary growth in these categories. Shoppers’ buying habits shifted during the last several months of restricted activities and products in the category of ‘home essentials’ including home office, food & storage, tech resources and beautification of home have become shoppers’ primary interest.
Through The Big Find and similar initiatives, QVC and HSN have built a track record of launching and fostering the growth of up-and-coming brands and small businesses by harnessing the power of storytelling and discovery-driven shopping experiences. Over the years, the two retailers have helped multiple entrepreneurial brands become national and international success stories, including IT Cosmetics, TATCHA, SPANX®, Junior’s Cheesecake, Korres, and others.
“Our business has always been rooted in discovering and nurturing authentic, emerging brands, and our customers have really enjoyed getting to know the many inspiring entrepreneurs and products we discovered through last year’s Big Find,” said Mary Campbell, Chief Merchandising Officer, Qurate Retail Group, and Chief Commerce Officer, QVC US. “We’re excited about building on that success with this year’s search. By adding new categories, we look forward to creating even more opportunities for entrepreneurs with unique products and compelling stories to work with us in curating differentiated product experiences for our customers.”
Last year’s inaugural Big Find nationwide search brought in more than 650 entries from 43 US states, the District of Columbia, and 12 countries including Australia, Canada, Germany, India, South Africa, Switzerland and United Kingdom, among others. More than 65 rising brands in beauty and fashion were selected to introduce their products across QVC and HSN platforms throughout 2020, including Act & Acre, Alkaglam, Mented Cosmetics, Follain, Have Some Fun Today, Valencia Key and many more. This year, QVC and HSN expect to exceed the number of brands identified through The Big Find 2020.
“Participating in The Big Find and becoming a part of the QVC and HSN vendor community has been an incredible journey,” said KJ Miller, Co-Founder, Mented Cosmetics. “The platforms have allowed us to share our story with a new set of customers and bring our brand to life in a way we would not be able to achieve through traditional retail channels. The teams at QVC and HSN have guided our way throughout this entire experience, providing us with invaluable feedback and support. We have already seen strong growth to our business, and we are looking forward to continued success together.”
QVC and HSN have further deepened their support of small businesses this year through Qurate Retail’s Small Business Spotlight initiative, in collaboration with the NRF Foundation. Through this initiative, QVC and HSN have provided a visibility platform and a mentorship program to approximately 20 small businesses across the country. In addition, the companies are launching a new phase of the Small Business Spotlight to highlight Black-owned small businesses across their on-air and digital platforms as well as Black-owned brands that are current QVC and HSN vendors.
To learn more about The Big Find, search “The Big Find” on QVC.com and HSN.com.
About QVC® and HSN®
QVC delivers the joy of discovery through the power of relationships. Every day, QVC engages millions of shoppers in a journey of discovery through an ever-changing collection of familiar brands and fresh new products, from home and fashion to beauty, electronics, and jewelry. Along the way, QVC connects shoppers to interesting personalities, engaging stories, and award-winning customer service. Based in West Chester, PA and founded in 1986, QVC has retail operations in the U.S., the U.K., Germany, Japan, Italy, and through a joint venture in China. Worldwide, QVC engages shoppers on 13 broadcast networks reaching approximately 380 million homes and on multiple websites, mobile apps, and social pages. To learn more, visit corporate.qvc.com, follow @QVC on Facebook, Instagram, or Twitter, or follow QVC on Pinterest, YouTube, or LinkedIn.
HSN delivers the thrill of discovery through inspiring her passions. HSN is a leading interactive and lifestyle retailer, offering a curated assortment of exclusive products and top brand names to its customers. HSN incorporates entertainment, personalities, and industry experts to provide an entirely unique shopping experience. At HSN, customers find exceptional selections in health and beauty, jewelry, home/lifestyle, fashion/accessories, and electronics. HSN engages customers on two broadcast networks reaching approximately 92 million homes, and on a website, mobile apps, and social pages. HSN was founded over 40 years ago as the first shopping network and is based in St. Petersburg, Fla. To learn more, visit corporate.hsn.com, follow @HSN on Facebook, Instagram, or Twitter, or follow HSN on Pinterest, YouTube, or LinkedIn.
Qurate Retail, Inc. (NASDAQ: QRTEA, QRTEB) includes QVC®, HSN, Zulily® and the Cornerstone brands (collectively, “Qurate Retail GroupSM“), as well as other minority interests and green energy investments. Qurate Retail Group believes in a Third Way to Shop® – beyond transactional ecommerce or traditional brick-and-mortar stores. In addition to being #1 in video commerce, Qurate Retail Group is among the top 10 ecommerce retailers in North America (according to Digital Commerce 360) and is a leader in mobile commerce and social commerce. For more information, visit www.qurateretailgroup.com, follow @QurateRetailGrp on Facebook, Instagram or Twitter, or follow Qurate Retail Group on YouTube or LinkedIn.
Logo – https://mma.prnewswire.com/media/1092805/QVC_Logo.jpg
Logo – https://mma.prnewswire.com/media/1092804/HSN_Logo.jpg
SOURCE QVC and HSN