
IMTC announces its first Remittances & Migration Conference, IMTC LATAM 2017 in Antigua, Guatemala on March 8-10, 2017
MIAMI, Jan. 4, 2017 /PRNewswire-HISPANIC PR WIRE/ — IMTC, the premier events of the International Money Transfer & Payments Industry, has announced today that its first remittance & migration conference of 2017 will be held in Antigua, Guatemala at the Porta Hotel. IMTC LATAM 2017 will be its first conference in Central America and will draw attendees from the Americas & Europe.
Remittances to Guatemala will surpass US 7 Billion for 2016, an all-time high. Remittances to Guatemala have grown steadily since 2010 with an average growth of 6% per year, outperforming most of the countries in the region. But also El Salvador, Honduras and even Mexico has seen remittances grow in 2016, all of them reaching all-time highs. Remittances to Honduras are expected to reach 4 billion while El Salvador could reach 4.5 B when year-end statistics are published. Higher incomes in the US and Trump fears are cited as reasons for the increases.
The main objective of this event is to explore the remittance market in the region, learn what bank and non-bank institutions are doing to serve the families of migrants, the financial inclusion efforts, the technological innovations that are slowly reaching this market as well as the migration-related laws and regulations implemented in several countries (anti-coyote laws) and the humane treatment of migrant minors.
Hugo Cuevas-Mohr, Director at IMTC, states: “Now that migration & remittances are at the center of the political debates in Europe & the US, it is important for the industry to work together with the civil society, regulators & politicians. The importance of remittances to every country in the region is enormous and we must work together to defend the right of migrants to help their families back home. The industry has always been part of the solution.”
Mr. Cuevas-Mohr will be visiting Guatemala on January 15-18 to meet with representatives from the industry, the government and the media to increase awareness on the coming event and discuss agenda topics with potential speakers and panelists.
IMTC (http://imtconferences.com/) organizes IMTC WORLD in Miami Beach, the largest industry gathering in the world, IMTC USA in San Francisco (June), IMTC EMEA in Madrid (April) and IMTC AFRICA in Nairobi, Kenya (September).
Information
Claudia Avila ([email protected]) +1 3057420759 +
”Bear Hugs Toy Drive” Brings Plush Toys & Healing Power of Music to Miller Children’s
LONG BEACH, Calif., Jan. 4, 2017 /PRNewswire-HISPANIC PR WIRE/ — On Wednesday, Dec. 21, hundreds of teddy bears and plush toys made their way into the arms of pediatric patients at Miller Children’s & Women’s Hospital Long Beach. The donation was part of the “Bear Hugs Toy Drive” launched by Liset Meruelo, wife of prominent Cuban-American businessman Alex Meruelo, of the Meruelo Group.
Photo – http://mma.prnewswire.com/media/453592/Bear_Hugs_Toy_Drive_1.jpg
Photo – http://mma.prnewswire.com/media/453593/Bear_Hugs_Toy_Drive_2.jpg
Photo – http://mma.prnewswire.com/media/453594/Music_Therapy_Donation___Miller_Childrens.jpg
During the holiday season, Meruelo Group employees, families and friends across Southern California collect bears and stuffed animals to comfort hospitalized children.
To help deliver the toys and spread a holiday joy, Liset Meruelo brought along a few surprise guests including costumed characters from Party Princess Productions dressed as “Frozen’s“ Elsa and Anna, and “Star Wars'” Darth Vader, Jedi and a Stormtrooper.
This is the 19th year teddy bears and stuffed animals were collected for the “Bear Hugs Toy Drive,” but this year came with an extra special delivery. During the visit, Liset and Alex Meruelo made a donation of $20,000 to support the Music Therapy Program – part of the Child Life Program – at Miller Children’s.
Studies have shown that patients who receive music therapy in conjunction with traditional therapies may need less pain medication, go home earlier, and have decreased levels of anxiety compared to patients who do not receive music therapy.
“From our tiniest patients in the Neonatal Intensive Care Unit to our teen patients, our Music Therapy Program is instrumental in helping our patients heal,” says Laurel Terreri, MA, MT-BC, board-certified music therapist, Miller Children’s.
Through their generous donation, the Music Therapy Program will expand to the Infusion Center at Miller Children’s. The majority of the patients who use the Infusion Center are children and adolescents with cancer and other serious blood disorders, who need to come back to the hospital on a regular basis for chemotherapy treatment or blood transfusions.
“Treatments and procedures done in the Infusion Center can take anywhere from one to eight hours,” says Terreri. “Music therapy can be used as a distraction for patients that may be experiencing anxiety or pain during prolonged treatments.”
Liset and Alex Meruelo are longtime supporters of Miller Children’s. This is their second donation to the Music Therapy Program. Liset Meruelo also volunteered as a NICU cuddler, where she supports the development and growth of premature babies by interacting with them during times when their parents can’t be with them.
“Music heals the soul and when these kids are going through transfusions or chemotherapy, we want to be able to provide them with the support, hope and reassurance that they need to heal,” says Liset Meruelo, philanthropist and friend of Miller Children’s.
Sodexo Challenges Students Nationwide to Reduce Food Waste to Landfills with Spark 101 STEM Skills Video
GAITHERSBURG, Maryland, Jan. 4, 2017 /PRNewswire-HISPANIC PR WIRE/ — With the support of Sodexo, world leader in Quality of Life services, teachers nationwide now have a new resource specifically designed to help students explore applications of science, technology, engineering and math (STEM) in real-world food waste and environmental sustainability challenges. Teachers are invited to use a new Spark 101 STEM Skills Video to engage students in an example of authentic problem-solving based on actual challenges faced by employers. In Sodexo’s Spark 101 challenge, students are asked to apply their environmental science and analytical skills to help Sodexo’s client reduce food waste typically sent to the landfill.
In 2015, the United States Department of Agriculture (USDA) estimated that while nearly 60,000 job openings become available in the U.S. annually, only 35,000 qualified graduates are projected to fill them. Of those openings:
- 50% will be in management and business
- 27% will be in science, technology, engineering and mathematics (STEM) fields
- 12% will be in education, communication, and governmental services
- 15% of the jobs will be in food and biomaterials production
Students who are passionate about global sustainability may be unaware of both the relevant career paths and the relationship between food waste and food service. With an eye toward increasing that awareness, Sodexo turned to Spark 101 to engage diverse students in STEM coursework and strengthen pathways to potential careers in these fields.
“Spark 101 STEM skills videos use a format proven to be effective in schools. An independent evaluation found that they increase STEM career awareness and skills, with significant positive effects on STEM engagement among students,” said Sodexo’s CEO for Schools in North America, Stephen Dunmore. “Surveys also showed that 80 percent of students want teachers to integrate case study challenges into classwork and want employers to provide more case studies.”
In 2016, Sodexo awarded the nonprofit a grant to increase STEM engagement for 20,000 students through Spark 101’s free, short, career-based case study videos connecting high school coursework to STEM careers, specifically those in food service and sustainability.
“Each year four million students graduate high school without having had an opportunity to tackle a real-world problem. And employers need options other than internships to introduce students to viable careers and critical skills,” said Jane Kubasik, founder and president of the 114th Partnership. “We are very excited to add Sodexo’s real workplace challenges to our library to help more learners connect passions to facilities management and food service career pathways while cultivating the necessary STEM skills to drive future innovation.”
Spark 101 STEM skills videos, presented by employers like Sodexo, use an online interactive video format to let students work on real challenges faced by professionals in business, government, nonprofit, and academic institutions. The 10-minute classroom videos—co-developed by educators, employers, and Spark 101 design experts—engage students in authentic STEM problem solving, aligned to curriculum and educational standards for easy classroom integration. Secondary teachers can access more than 50 free Spark 101 STEM skills videos and curriculum-aligned teaching materials online at www.spark101.org.
Spark 101 is a program of the 114th Partnership, a national nonprofit that helps students navigate education and career pathways. By connecting classwork to professional pathways, the organization will equip one million students with the knowledge they need to connect their personal passions to high opportunity careers.
Sodexo delivers more than 100 services across North America that enhance organizational performance, contribute to local communities and improve quality of life. The Fortune Global 500 company is a leader in delivering sustainable, integrated facilities management and foodservice operations.
Learn more about Sodexo at its corporate blog, Sodexo Insights.
Logo – http://mma.prnewswire.com/media/349448/right_4color_Logo.jpg
American Honda Sets All-Time Sales Records Powered by Demand for Cars and Trucks
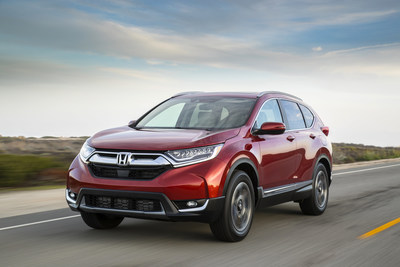
TORRANCE, California, Jan. 4, 2017 /PRNewswire-HISPANIC PR WIRE/ — American Honda Motor Co., Inc. today reported an all-time annual sales record of 1,637,942 Honda and Acura vehicles for 2016, an increase of 3.2 percent to eclipse the company’s previous best set in 2015. AHM also set new annual and monthly total truck sales records, gaining 5.6 percent on sales of 813,243 units for the year, and 17.4 percent in December on sales of 85,568. Honda Division sales also set a new annual record, rising 4.8 percent on sales of 1,476,582 vehicles in 2016, as well as a new December record, gaining 6.9 percent on sales of 143,329 units. Honda trucks set new all-time best annual and monthly marks, gaining 6.7 percent on sales of 705,387 for the year, and 19 percent on sales of 73,380 for December. Honda cars were up 3.1 percent for the year on sales of 771,195 units. Acura car and truck sales totaled 17,148 in December, up 1.9 percent over the same month last year. Acura total annual sales reached 161,360 in 2016, down 8.9 percent for the year. However, Acura trucks set a new all-time monthly record in December, gaining 8.9 percent on sales of 12,188 vehicles.
“2016 was a very rewarding year for American Honda in which we set a second consecutive all-time sales record while maintaining our unique focus on retail sales to individual buyers,” said John Mendel, executive vice president of the Automobile Division of American Honda Motor Co., Inc. “We are going to build on this success with a continued focus on strong products and sound sales strategies that increase quality and value for our customers.”
Honda
The Honda Division recorded new all-time and monthly records while two core models set all-time annual and a monthly record for the Honda Division. Further, the Civic, Accord and CR-V combined to easily surpass 1 million units in 2016 for the 4th consecutive year, and a December sales flourish for the Ridgeline and the recently-released Civic Hatchback made for an exciting close of a successful year.
- Honda Division sales set a new annual total vehicle record, up 4.8 percent over last year’s record on sales of 1,476,582.
- Honda trucks also set a new annual mark, breaking the 2015 record with an increase of 6.7 percent on sales of 705,387 for the year, while setting a new all-time best monthly record, jumping 19 percent on sales of 73,380 units in December.
- CR-V, America’s best-selling SUV, set new all-time annual and monthly records: with sales for the year at 357,335, a 3.4 percent gain, and December sales of 37,778 for a 21.1 percent leap to grab its best month in history. CR-V sales got an end-of-year boost as the all-new 2017 model went on sale in the last 10 days of December.
- The new Ridgeline had its best sales month since its debut last spring, with 4,085 units sold in December.
- With Civic setting an all-time annual sales mark of 366,927 (up 9.4 percent) the new Civic Hatchback made a splash in December, contributing over 4,000 sales for the month.
- HR-V sales jumped dramatically in 2016, gaining 95.5 percent over 2015 on sales of 82,041 units. HR-V was also up 90.7 percent in December on sales of 9,034 vehicles.
“It was an amazing year for the Honda brand with our product lineup full of industry best models,” said Jeff Conrad, senior vice president & general manager of the Honda Division. “Our strong December also builds momentum for 2017 which is shaping up to be another great year as still more new Honda products will give customers exciting new choices.”
Acura
Acura Division sales in December topped 2015 with positive contributions from both cars and trucks. RDX had a best-ever year and month, while MDX enjoyed its best sales month of 2016, pushing Acura trucks to a new all-time record month. Despite declining luxury sedan sales in the U.S., TLX sales were up and RLX made a notable gain in December. Continuing its steady production ramp up, the second-generation NSX supercar had its best month to date.
- Acura trucks recorded best-ever monthly sales, gaining 8.9 percent on sales of 12,188 units.
- Total Acura truck sales exceeded 100,000 units for the third year in a row.
- RDX set a new all-time monthly sales record, jumping 20.3 percent on sales of 5,945 vehicles, as well as a new annual benchmark, rising 2.6 percent on sales of 52,361 units.
- MDX sales in 2016 topped 50,000 units for the fifth straight year, helping extend its reign as the all-time best-selling luxury three-row SUV in America.
- Acura sold 68 NSX supercars in December, its best month since sales began last spring.
“With Acura trucks leading the way and the TLX performing strongly in a challenging market for sedans, we were able to finish our 30th anniversary year on a strong note,” said Jon Ikeda, vice president & general manager of the Acura division. “We’re excited to carry this momentum, with a strong future vision for Acura, into the new year.”
|
American Honda Vehicle Sales for December 2016 |
||||||||||||||||||||
|
Month-to-Date |
Year-to-Date |
|||||||||||||||||||
|
December |
December |
DSR** % |
MoM % |
December |
December |
DSR** % |
YoY % |
|||||||||||||
|
American Honda Total |
160,477 |
150,893 |
10.3% |
6.4% |
1,637,942 |
1,586,551 |
3.6% |
3.2% |
||||||||||||
|
Total Car Sales |
74,909 |
78,016 |
-0.4% |
-4.0% |
824,699 |
816,127 |
1.4% |
1.1% |
||||||||||||
|
Total Truck Sales |
85,568 |
72,877 |
21.8% |
17.4% |
813,243 |
770,424 |
5.9% |
5.6% |
||||||||||||
|
Honda Total Car Sales |
69,949 |
72,389 |
0.2% |
-3.4% |
771,195 |
748,198 |
3.4% |
3.1% |
||||||||||||
|
Honda Total Truck Sales |
73,380 |
61,681 |
23.4% |
19.0% |
705,387 |
661,188 |
7.0% |
6.7% |
||||||||||||
|
Acura Total Car Sales |
4,960 |
5,627 |
-8.6% |
-11.9% |
53,504 |
67,929 |
-21.0% |
-21.2% |
||||||||||||
|
Acura Total Truck Sales |
12,188 |
11,196 |
12.9% |
8.9% |
107,856 |
109,236 |
-0.9% |
-1.3% |
||||||||||||
|
Total Domestic Car Sales |
62,639 |
74,032 |
-12.3% |
-15.4% |
749,038 |
803,167 |
-6.4% |
-6.7% |
||||||||||||
|
Honda Division |
57,871 |
68,564 |
-12.5% |
-15.6% |
697,016 |
737,468 |
-5.2% |
-5.5% |
||||||||||||
|
Acura Division |
4,768 |
5,468 |
-9.6% |
-12.8% |
52,022 |
65,699 |
-20.6% |
-20.8% |
||||||||||||
|
Total Domestic Truck Sales |
85,568 |
72,877 |
21.8% |
17.4% |
813,243 |
770,419 |
5.9% |
5.6% |
||||||||||||
|
Honda Division |
73,380 |
61,681 |
23.4% |
19.0% |
705,387 |
661,183 |
7.0% |
6.7% |
||||||||||||
|
Acura Division |
12,188 |
11,196 |
12.9% |
8.9% |
107,856 |
109,236 |
-0.9% |
-1.3% |
||||||||||||
|
Total Import Car Sales |
12,270 |
3,984 |
219.4% |
208.0% |
75,661 |
12,960 |
485.7% |
483.8% |
||||||||||||
|
Honda Division |
12,078 |
3,825 |
227.5% |
215.8% |
74,179 |
10,730 |
593.6% |
591.3% |
||||||||||||
|
Acura Division |
192 |
159 |
25.2% |
20.8% |
1,482 |
2,230 |
-33.3% |
-33.5% |
||||||||||||
|
Total Import Truck Sales |
0 |
0 |
0.0% |
0.0% |
0 |
5 |
-100.0% |
-100.0% |
||||||||||||
|
Honda Division |
0 |
0 |
0.0% |
0.0% |
0 |
5 |
-100.0% |
-100.0% |
||||||||||||
|
Acura Division |
0 |
0 |
0.0% |
0.0% |
0 |
0 |
0.0% |
0.0% |
||||||||||||
|
MODEL BREAKOUT BY DIVISION |
||||||||||||||||||||
|
Honda Division Total |
143,329 |
134,070 |
10.9% |
6.9% |
1,476,582 |
1,409,386 |
5.1% |
4.8% |
||||||||||||
|
* ACCORD |
33,873 |
35,056 |
0.2% |
-3.4% |
345,225 |
355,557 |
-2.6% |
-2.9% |
||||||||||||
|
* CIVIC |
31,482 |
32,796 |
-0.5% |
-4.0% |
366,927 |
335,384 |
9.8% |
9.4% |
||||||||||||
|
CLARITY FCV |
8 |
0 |
0.0% |
0.0% |
8 |
0 |
0.0% |
0.0% |
||||||||||||
|
CR-Z |
160 |
316 |
-47.5% |
-49.4% |
2,338 |
3,073 |
-23.7% |
-23.9% |
||||||||||||
|
FCX CLARITY |
0 |
2 |
-100.0% |
-100.0% |
0 |
2 |
-100.0% |
-100.0% |
||||||||||||
|
* FIT |
4,425 |
4,197 |
9.3% |
5.4% |
56,630 |
52,724 |
7.8% |
7.4% |
||||||||||||
|
INSIGHT |
1 |
22 |
-95.3% |
-95.5% |
67 |
1,458 |
-95.4% |
-95.4% |
||||||||||||
|
CROSSTOUR |
0 |
613 |
-100.0% |
-100.0% |
726 |
9,104 |
-92.0% |
-92.0% |
||||||||||||
|
* CR-V |
37,778 |
31,185 |
25.6% |
21.1% |
357,335 |
345,647 |
3.7% |
3.4% |
||||||||||||
|
HR-V |
9,034 |
4,737 |
97.8% |
90.7% |
82,041 |
41,969 |
96.1% |
95.5% |
||||||||||||
|
ODYSSEY |
10,411 |
11,800 |
-8.5% |
-11.8% |
120,846 |
127,736 |
-5.1% |
-5.4% |
||||||||||||
|
PILOT |
12,072 |
13,344 |
-6.2% |
-9.5% |
120,772 |
136,212 |
-11.0% |
-11.3% |
||||||||||||
|
RIDGELINE |
4,085 |
2 |
211,714.8% |
204,150.0% |
23,667 |
520 |
4,466.2% |
4,451.3% |
||||||||||||
|
*** Memo: Accord FHEV |
3,124 |
222 |
1,359.3% |
1,307.2% |
9,179 |
11,063 |
-16.8% |
-17.0% |
||||||||||||
|
Memo: Accord PHEV |
0 |
1 |
-100.0% |
-100.0% |
0 |
64 |
-100.0% |
-100.0% |
||||||||||||
|
Memo: Civic Hybrid |
12 |
263 |
-95.3% |
-95.4% |
896 |
4,887 |
-81.6% |
-81.7% |
||||||||||||
|
Memo: Fit EV |
0 |
0 |
0.0% |
0.0% |
0 |
1 |
-100.0% |
-100.0% |
||||||||||||
|
Acura Division Total |
17,148 |
16,823 |
5.7% |
1.9% |
161,360 |
177,165 |
-8.6% |
-8.9% |
||||||||||||
|
ILX |
1,079 |
1,960 |
-42.9% |
-44.9% |
14,597 |
18,531 |
-21.0% |
-21.2% |
||||||||||||
|
NSX |
68 |
0 |
0.0% |
0.0% |
269 |
0 |
0.0% |
0.0% |
||||||||||||
|
RLX / RL |
192 |
159 |
25.2% |
20.8% |
1,478 |
2,195 |
-32.4% |
-32.7% |
||||||||||||
|
TL |
0 |
0 |
0.0% |
0.0% |
0 |
88 |
-100.0% |
-100.0% |
||||||||||||
|
TLX |
3,621 |
3,508 |
7.0% |
3.2% |
37,156 |
47,080 |
-20.8% |
-21.1% |
||||||||||||
|
TSX |
0 |
0 |
0.0% |
0.0% |
4 |
35 |
-88.5% |
-88.6% |
||||||||||||
|
MDX |
6,243 |
6,254 |
3.5% |
-0.2% |
55,495 |
58,208 |
-4.4% |
-4.7% |
||||||||||||
|
RDX |
5,945 |
4,942 |
24.8% |
20.3% |
52,361 |
51,026 |
3.0% |
2.6% |
||||||||||||
|
ZDX |
0 |
0 |
0.0% |
0.0% |
0 |
2 |
-100.0% |
-100.0% |
||||||||||||
|
*** Memo: ILX Hybrid |
0 |
1 |
-100.0% |
-100.0% |
1 |
23 |
-95.6% |
-95.7% |
||||||||||||
|
Memo: RLX Hybrid |
31 |
16 |
100.9% |
93.8% |
235 |
250 |
-5.7% |
-6.0% |
||||||||||||
|
Memo: TSX Wagon |
0 |
0 |
0.0% |
0.0% |
0 |
2 |
-100.0% |
-100.0% |
||||||||||||
|
Selling Days |
27 |
28 |
307 |
308 |
||||||||||||||||
|
**** Hybrid |
3,396 |
841 |
318.8% |
303.8% |
12,985 |
20,818 |
-37.4% |
-37.6% |
||||||||||||
|
* Honda and Acura vehicles are made of domestic & global sourced parts |
||||||||||||||||||||
|
** Daily Selling Rate |
||||||||||||||||||||
|
*** Memo line items are included in the respective model total |
||||||||||||||||||||
|
**** Hybrid includes FHEV, PHEV, CR-Z, Civic Hybrid, Insight, ILX Hybrid, RLX Hybrid, RLX Sport Hybrid, MDX Sport Hybrid and NSX |
||||||||||||||||||||
Photo – http://mma.prnewswire.com/media/453804/American_Honda_Motor_Co_Inc_2017_Honda_CR_V.jpg
Logo – http://mma.prnewswire.com/media/95602/honda_logo.jpg
Honda Teams With DreamWorks Animation to Create Virtual Reality “Honda Dream Drive” Experience
LAS VEGAS, Jan. 4, 2017 /PRNewswire-HISPANIC PR WIRE/ — Honda announced today that it has collaborated with DreamWorks Animation to demonstrate a new augmented and virtual reality content and solutions test bed for the in-vehicle experience. Honda will demonstrate a proof of concept version of its Honda Dream Drive in-car virtual reality prototype featuring DreamWorks Animation content at CES, January 5-8, 2017. CES attendees are invited to experience Dream Drive at the Honda booth (LVCC, North Hall – 7312) during show hours.

The Honda and DreamWorks alliance will focus on creating a software development kit that fuses live telematics data to feed in-vehicle entertainment, education and information applications that are contextually synchronized with the motion of the vehicle in real-time. The initiative brings to life the Honda Dream Drive prototype, which enables passengers to gaze into other worlds while riding as passengers in Honda vehicles.
“Entertainment in the car is rapidly changing as consumers rely more and more on personal devices and Honda sees new opportunities to create unique experiences for our customers,” said John Moon, Developer Relations Lead at Honda Developer Studio. “The collaboration with DreamWorks enables Honda to enhance the in-vehicle experience through new ways of delivering information and entertainment.”
Honda Dream Drive
Honda Dream Drive uses a VR headset to immerse passengers in a virtual reality world triggered by the motion of the vehicle. CES attendees will have the opportunity to experience the proof of concept prototype, featuring content from DreamWorks’ recent animated movie Trolls.
“We see the cabin of an automobile as an untapped platform for delivering entertaining and educational experiences to consumers,” said DreamWorks Animation’s Chief Animation Technology Officer Jeff Wike. “Working with Honda has enabled us to bring our collective talent together to explore and identify opportunities in adapting and creating new forms of consumer engagement.”
DreamWorks Animation Collaboration
Honda originated the alliance with DreamWorks Animation through the Honda Developer Studio, its Silicon Valley-based open innovation initiative. DreamWorks regularly collaborates with innovators to push the boundaries of interactive and digital entertainment with other leading companies. The goal with Dream Drive is to move beyond entertainment in the vehicle to entertainment for the vehicle.
“The idea is to evolve from parallel play to connected, cooperative play that connects passengers and drivers to their drive, each other and the world around them,” said Bryan Biniak, Entrepreneur in Residence at Nokia Growth Partners and co-developer of the Honda Dream Drive experience. “We want vehicle time to include the ability to have heads-up interactive entertainment, educational and informational experiences as well as increased personal productivity.”
About Honda Developer Studio
Honda Developer Studio (HDS) is an open innovation initiative that enables developers to work directly with Honda engineers to create apps that are road-ready more quickly. For more information, visit https://developer.hondasvl.com/ and follow along on Twitter at @HondaDeveloper.
About Honda Technology
Honda is creating technologies and products that advance the company’s clean, safe, fun and connected brand values. These efforts include advancements in automated vehicles, connectivity and ultra-low carbon mobility. In North America, the company has more than 300,000 vehicles on the road equipped with the Honda Sensing or AcuraWatch safety and driver-assistive technologies and nearly 400,000 vehicles featuring Apple CarPlay® and Android Auto™ compatibility. Honda also is testing advanced automated vehicle technologies in Japan and North America and is targeting 2020 for the deployment of highly automated vehicles on U.S. highways. Honda also is working to fulfill its environmental and safety vision: “to realize the joy and freedom of mobility and a sustainable society where people can enjoy life.” Toward this target, Honda is striving to make two-thirds of its global automobile sales from hybrid, plug-in hybrid and electrified vehicles including fuel cell and battery electric vehicles by around 2030.
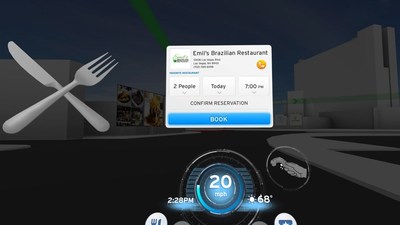
Photo – http://mma.prnewswire.com/media/453625/Honda_Dream_Drive_Trolls.jpg
Photo – http://mma.prnewswire.com/media/453624/Honda_Dream_Drive.jpg
Photo – http://mma.prnewswire.com/media/95602/honda_logo.jpg
Blue Bull Energy announces consulting firm launch and projects in Mexico and the U.S.
HOUSTON, Jan. 4, 2017 /PRNewswire-HISPANIC PR WIRE/ — Blue Bull Energy announces its launch as a minority-owned energy consulting firm providing strategy, business development and technical oil and gas expertise to clients in Mexico and in the United States with a business plan to evolve into a full-scale energy company.

The announcement was made by Alma Del Toro Ford, Blue Bull Energy’s president, who said she founded the firm to incubate her vision of an energy company that develops business as much as communities. Del Toro Ford recently served as Western Hemisphere Senior Business Development Advisor at BP, one of several leadership roles she held as part of 17 years of experience with the energy giant.
Blue Bull has kicked off its business with several significant projects that will contribute to growing capability within the Mexico energy industry:
- COTEMAR Mexico – E&P and offshore services strategy
- Statoil – Mexico
- Trust Control International – Business development
- EMUSA Oil & Gas – Commodities and investment
- Rust Patrol – New market access
- USA oil and gas start-up – Development, evaluation, private equity funding and deal structuring
Blue Bull has also formed business alliances with some of the most influential firms in México, EY Energy Consulting, Marcos y Asociados and with former Secretary of Energy Directors. In addition, and aligned with its commitment to giving back, Blue Bull chaired the first black tie gala for the Multicultural Education and Counseling Through the Arts (MECA) and was successful in exceeding the fundraiser goal of $35,000 USD!
MECA is a community-based non-profit organization committed to the healthy development of underserved families here in Houston. Del Toro Ford is passionate about developing opportunities for others as much as developing business: “I am beyond honored to be a MECA Board Member. I immediately fell in love with MECA’s mission, giving a chance to children and youth who don’t have access to role models or the means to aspire to an exciting horizon. Given my humble background, MECA felt like home right away. I see myself in every MECA student.”
About Blue Bull Energy
Blue Bull Energy provides strategy and business development consulting in Mexico and the United States and already has a mixed portfolio; they are on the path to becoming a full-scale energy business.
Media Contact
Alma Del Toro Ford
(832) 551-6997
[email protected]
Bluebullenergy.com
Logo – http://mma.prnewswire.com/media/453412/Blue_Bull_Energy_Logo.jpg
Cablevisión Adds ¡HOLA! TV to its Lineup, Expanding its Success to Argentina
MIAMI, Jan. 4, 2017 /PRNewswire-HISPANIC PR WIRE/ — ¡HOLA! TV, the exclusive news channel on celebrities, royalty and fashion, is already available to Cablevisión Digital clients on channel 409, both on live TV as well as on its Cablevisión On Demand and Cablevisión Flow platforms.
Atresmedia Internacional has been involved in the programming of Cablevisión with Antena 3 Internacional for a decade, and with ATRESERIES for just a few weeks, the youngest channel in the group.
As Mar Martínez Raposo, Director of Atresmedia Internacional said, “being part of Cablevisión’s lineup with the three channels in our international portfolio makes us stronger in the region, and allows us to close a year of huge successes.” Ignacio Sanz de Acedo, CEO & General Manager of ¡HOLA! TV, said that “this agreement allows Argentine television viewers to enjoy the latest in fashion, lifestyle, royalty and glamor; it is a golden ending to a spectacular year, especially in the distribution area.”
“Our goal is to continue adding more and better content, with the greatest variety of programming possible. That is why we are very pleased with the launch of a brand as prestigious as ¡HOLA! TV in our digital lineup. This genre of lifestyle and information on celebrities, royalty and interesting characters be very well received and accepted by our clients,” said Antonio Álvarez, Programming Manager for Cablevisión.
DOWNLOAD IMAGES
https://we.tl/tRb6B3tGqw
About Atresmedia Internacional
Atresmedia Internacional heads the Atresmedia Group, which includes its three international channels: Antena 3, Atreseries and ¡HOLA! TV. Positioned as a global leader in the production and distribution of content in Spanish, Atresmedia is the private European operator with the most channels and the highest number of subscribers outside its own borders, with a presence in all Spanish-speaking countries in Latin America, as well as in the USA, Canada, Europe and Africa. Atresmedia Internacional is committed to quality and variety through a complementary supply of content.
About ¡HOLA! TV
¡HOLA! TV is a joint venture formed by ATRESMEDIA INTERNACIONAL and the magazine ¡HOLA!, the most respected and exclusive news source worldwide about celebrities, royalty, and the aristocracy. The programming of ¡HOLA! TV presents the best of the magazine ¡HOLA!, which publishes 34 editions for more than 120 countries, reinventing the magazine for television with news, exclusives, and special programming that reflect the style and philosophy of the ¡HOLA! brand. The channel’s coverage includes exclusive access to human interest stories, programs dedicated to the lifestyle of celebrities, and a special focus on news about royalty and the aristocracy all over the world. The main offices of ¡HOLA! TV are located in Miami, Florida, where original daily and weekly programs are also produced from its studios at Imagina U.S. Some of its other programs are produced by ¡HOLA! MEDIA and ATRESMEDIA, at its studios in Madrid, Spain.
About Cablevisión
Cablevisión is the leading company in the cable television market, with operations in 12 provinces and more than 90 locations in Argentina and in Uruguay. Its programming is quite varied thanks to numerous signals, reaching more than 3.5 million clients through its different services: Basic, Digital, HD and Max HD and Cablevisión On Demand products, and the recently launched Cablevisión Flow.
Mazda Reports December 2016 and Full-Year 2016 Sales
IRVINE, California, Jan. 4, 2017 /PRNewswire-HISPANIC PR WIRE/ — Wrapping up a year focused on long-term growth objectives, Mazda North American Operations (MNAO) today reported December U.S. sales of 28,754 vehicles, representing a decrease of 1.8 percent versus December of last year. There were 27 selling days in December 2016, versus 28 the year prior. As such, on a Daily Selling Rate (DSR) basis, the company posted an increase of 1.8 percent.
The company also reported calendar year (CY) 2016 total sales (combined fleet and retail) today, totaling 297,773, down 6.7 percent, following a 20-year-high record sales year in CY2015. There were 307 selling days in CY 2016, versus 308 in CY2015; the full-year DSR represented a decrease of 6.4 percent.
“In 2016, we developed a more defined focus on brand value management, which steered our business away from fleet sales and incentive pricing,” said Masahiro Moro, president and CEO of MNAO. “Rather than chasing sales simply for the sake of growth, we will continue to focus on transforming our business operations to deliver an experience that will result in higher customer and dealer loyalty, improved long-term residual value and increased satisfaction at all levels of our business, independent from sales volume numbers.”
Key December and CY2016 sales notes:
- As part of the overall sales strategy, MNAO significantly reduced fleet sales, with 20,359 vehicles sold in CY2016 representing a decrease of 28.0 percent YOY.
- Backing the fleet numbers out of the total vehicles sold, MNAO posted a slight decline in retail-only sales for CY2016, with 277,414 vehicles sold. This number represents a 4.6 percent decrease in sales YOY.
- With crossover SUV sales dominating the sales landscape in CY2016, Mazda’s crossover lineup shone this year. Overall, CX-3, CX-5 and CX-9 posted an increase of 13.6 percent in December. For the year, the three vehicles posted sales up 8.0 percent, with 146,843 vehicles sold in CY2016.
- With much of the U.S. now in the winter months, Mazda’s i-ACTIV All-Wheel Drive system – available optionally on all Mazda crossover SUVs – continues its popularity among crossover SUV buyers, with 63 percent of buyers choosing the option.
- Mazda CX-5 posted its best-ever month in December with 11,989 vehicles sold, making this its fifth best-ever month in CY2016. For the full year, CX-5 sold a record 112,235 vehicles, an increase of 5.0 percent YOY and CX-5’s best-ever sales year.
- Mazda CX-3 completed its first full year of sales, ending the year up 189.7 percent, with 18,557 vehicles sold.
- The all-new 2016 Mazda CX-9 launched during CY2016 and posted its best December since 2012, with 2,594 vehicles sold. This number represents an increase of 115.5 percent YOY.
- The Mazda MX-5 Miata finished December up 3.8% YOY, with 733 vehicles sold. Continued interest in MX-5, and early deliveries of the 2017 MX-5 RF, resulted in full-year sales of 9,465 vehicles in CY2016, an increase of 10.2 percent YOY. The 2017 MX-5 RF recorded 314 vehicles sold in the month of December.
- Major changes impacting sales in CY2016 included the discontinuation of sales of the Mazda2 and Mazda5, as well as the introduction of the 2016 CX-9 and 2017 MX-5 RF, and refreshed versions of the Mazda3 and Mazda6.
- Mazda’s December sales of 28,754 vehicles add up to more than $4.3 million in donations ($150 for every vehicle sold during the month) as part of the Mazda Drive for Good program in 2017. Total results for the 2016 charity event, which ran from November 21, 2016 to January 3, 2017, will be released at a later date.
Mazda Motor de Mexico (MMdM) reported December sales of 6,651 vehicles, down 19.0 percent versus December of last year. Total CY2016 sales for MMdM were 54,891 vehicles, representing a decrease of 12.7 percent when compared to CY2015.
Mazda North American Operations is headquartered in Irvine, California, and oversees the sales, marketing, parts and customer service support of Mazda vehicles in the United States and Mexico through nearly 700 dealers. Operations in Mexico are managed by Mazda Motor de Mexico in Mexico City. For more information on Mazda vehicles, including photography and B-roll, please visit the online Mazda media center at InsideMazda.MazdaUSA.com/Newsroom.
|
Month-To-Date |
Year-To-Date |
|||||||||
|
December |
December |
% |
% MTD |
December |
December |
% |
% YTD |
|||
|
2016 |
2015 |
Change |
DSR |
2016 |
2015 |
Change |
DSR |
|||
|
Mazda2 |
– |
1 |
(100.0)% |
(100.0)% |
3 |
297 |
(99.0)% |
(99.0)% |
||
|
Mazda3 |
8,102 |
9,838 |
(17.6)% |
(14.6)% |
95,567 |
107,884 |
(11.4)% |
(11.1)% |
||
|
Mazda5 |
2 |
299 |
(99.3)% |
(99.3)% |
375 |
8,609 |
(95.6)% |
(95.6)% |
||
|
Mazda6 |
3,688 |
4,168 |
(11.5)% |
(8.2)% |
45,520 |
57,898 |
(21.4)% |
(21.1)% |
||
|
MX-5 Miata |
733 |
706 |
3.8% |
7.7% |
9,465 |
8,591 |
10.2% |
10.5% |
||
|
CX-3 |
1,646 |
1,663 |
(1.0)% |
2.6% |
18,557 |
6,406 |
189.7% |
190.6% |
||
|
CX-5 |
11,989 |
11,417 |
5.0% |
8.9% |
112,235 |
111,450 |
0.7% |
1.0% |
||
|
CX-9 |
2,594 |
1,202 |
115.8% |
123.8% |
16,051 |
18,048 |
(11.1)% |
(10.8)% |
||
|
Total Vehicles |
||||||||||
|
CARS |
12,525 |
15,012 |
(16.6)% |
(13.5)% |
150,930 |
183,279 |
(17.7)% |
(17.4)% |
||
|
TRUCKS |
16,229 |
14,282 |
13.6% |
17.8% |
146,843 |
135,904 |
8.0% |
8.4% |
||
|
TOTAL |
28,754 |
29,294 |
(1.8)% |
1.8% |
297,773 |
319,183 |
(6.7)% |
(6.4)% |
||
|
Selling Days |
27 |
28 |
307 |
308 |
||||||
Logo – http://mma.prnewswire.com/media/53154/mazda_north_american_operations_logo.jpg